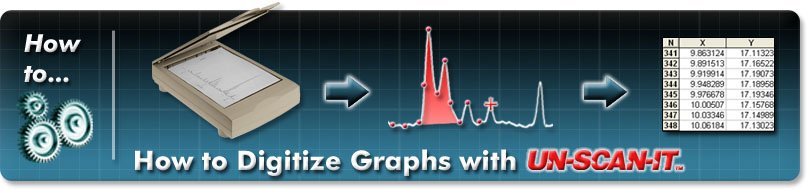
How to Digitize Graphs
The UN‑SCAN‑IT Graph Digitizing Software extracts (x,y) data values from graphical images. Although there are many options and considerations associated with digitizing graphs and digitizing plots, most of the basic steps to get the underlying xy data values from graph images remain the same. If you would like to try some of the digitizing steps described on this page, you can download our free demo program at https://www.silkscientific.com/demo/demo-graph.htm.
Basic Setup | How to Digitize a Graph
The first step to digitize a graph is to obtain and load a standard image file (JPG, TIFF, GIF, BMP, PNG, etc.). The image file can come from a scanner, digital camera, converted PDF file, email, internet, etc. The UN‑SCAN‑IT software can accept a variety of image formats to digitize xy graphs and plots (see Figure 1).
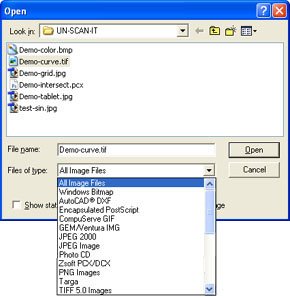
Figure 1. Load the image file.
The next step to is to select the Graph Digitizing Mode. These options allow you to choose between a variety of automatic and manual digitizing modes which include Standard Line, Intersecting Line, Dashed/Dotted line, Scatter Plot, and (x,y) Digitizing Tablet modes (see Figure 2). Descriptions of these options can be displayed by selecting the Help button from the Graph Digitizing Mode screen.
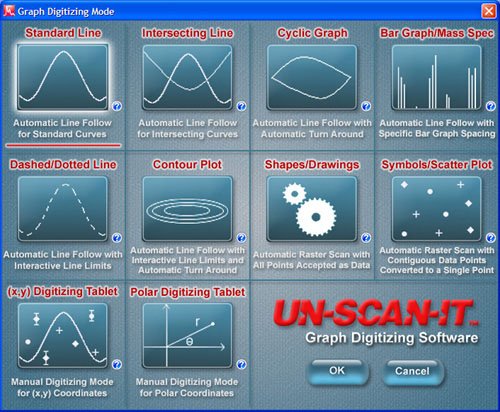
Figure 2. Select the Graph Digitizing Mode.
The Graph Digitizing Options screen will appear next. This screen allows you to choose the digitizing options that best fit your graph type. These options include Color Type, Scale, Grid Line Filter, and Digitizing Speed (see Figure 3). Details of these options can be displayed by selecting the Help button from the Graph Digitizing Options screen.
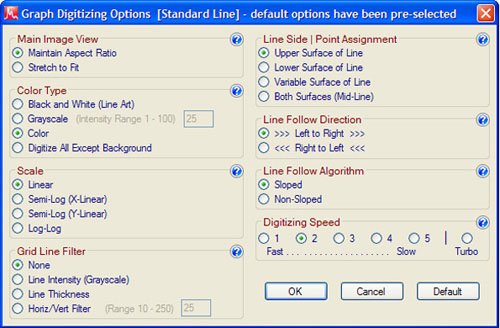
Figure 3. Select the Graph Digitizing Options.
Defining the Scale | How to Digitize a Graph
After the digitizing options have been selected, your graph image will be displayed along with a number of setup icons used to define the X scale, Y scale, starting points, etc. Simply use your mouse to drag each of the setup icons to their corresponding graphical locations (see Figure 4).
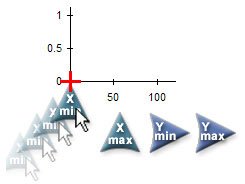
Figure 4. Drag the Setup Icons.
The zoom box in the upper right corner of the digitizing screen is useful for obtaining precise alignments during the axis setup process (the zoom window is for visual alignment purposes only, and all crosshair movements should be performed on the main image). Once all of the setup icons have been properly located, select the Digitize button located in the lower right corner of the digitizing screen (see Figure 5). Icon Setup Help is available from the Help menu.
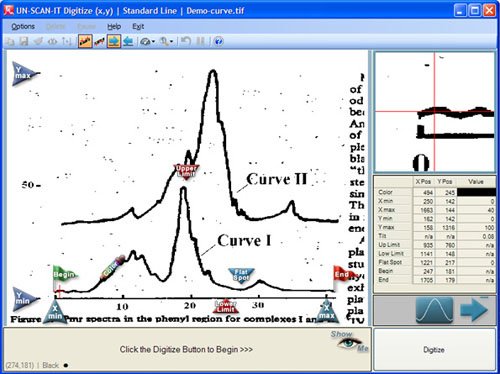
Figure 5. (x,y) Graph Digitizing Screen after Setup Icons have been assigned.
Digitizing the Graph | How to Digitize a Graph
If the current Scan Mode is Automatic, the UN‑SCAN‑IT software will begin to automatically extract the underlying (x,y) values from the graph and automatically move along the data curve (see Figure 6). If the current Scan Mode is Semi-Automatic or Manual, then you will be prompted to digitize the data points using either your computer mouse or keyboard arrow keys. You can toggle between Automatic and Manual Mode during the automatic digitizing process by clicking the Pause and Continue buttons, respectively. When the digitizing process is paused (Manual Mode), you can access and change settings in the Options menu or digitize additional points manually. When the digitizing process is complete, you can accept the digitized data values and return to the main menu (or digitize additional data points).
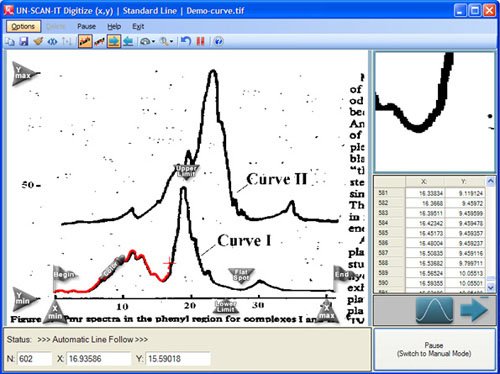
Figure 6. Digitizing Screen in Automatic Mode.
Analyzing & Exporting the Data | How to Digitize a Graph
After the data is digitized, UN‑SCAN‑IT can be used to analyze the graph, integrate peak areas, re-scale graphs, remove grid lines, smooth data, export data for publication quality graphs, etc. Select Graph (x,y) Data from the drop-down Graph menu contained on the UN‑SCAN‑IT main page. The graphics buttons at the left of the graph allow you to integrate peak areas, adjust x data spacing, smooth data, edit data, take derivatives, etc. Additional graphing choices are also contained in the graph Options menu (see Figure 7).
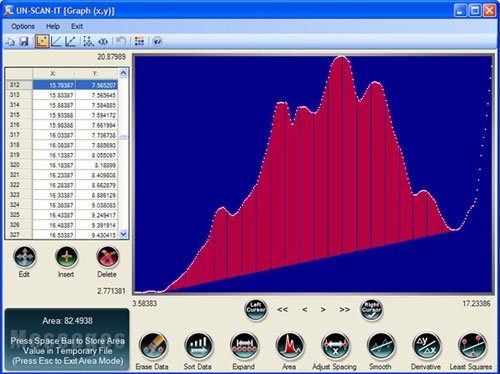
Figure 7. UN‑SCAN‑IT Graphing screen.
The (x,y) data can also be saved and exported from UN‑SCAN‑IT into other spreadsheet, graphics, or data analysis programs (see Figure 8).
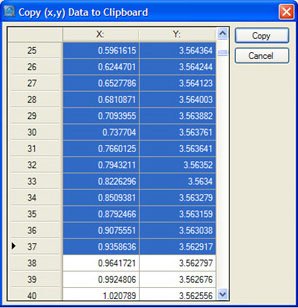
Figure 8. UN‑SCAN‑IT Copy (x,y) Data screen.
Click Here for Plot Digitizer Tutorial...
Additional Information