Graph Digitizing Software
Free Demo
37 Years Experience | Free Telephone & Email Support!
UN‑SCAN‑IT Free Demo | Windows
Click Here to Download the Free Demo Version of UN‑SCAN‑IT for Windows
- Click on the link above
- Download and run the installation file setup.exe
- Run the UN‑SCAN‑IT demo program (demo.exe) from the Desktop, Run Menu, or Programs Menu
Demo Version Info...
- The Free Demo is a fully functional version of the UN‑SCAN‑IT Graph Digitizing Software that includes several sample images, and also allows you to digitize your own sample image. The software should be intuitive, and there are context sensitive help buttons available.
- We recommend first digitizing one of the included sample graph images to familiarize yourself with the digitizing process.
- A Demo Video and Tutorial can be found below.
- An online User's Manual is available at www.silkscientific.com/manual/Manual70.pdf
- To purchase the full version, ordering information is available at www.silkscientific.com/order
- Customer Support: Email: info@silkscientific.com Tel: 1-801-377-6978 (USA)
UN‑SCAN‑IT Free Demo | Macintosh
Click Here to Download the Free Demo Version of UN‑SCAN‑IT for Macintosh
- Click on the link above
- Save the download file UNSCANIT 6.2 Demo.dmg to your Macintosh
- Open the disk image and drag the UN‑SCAN‑IT 6.2 Demo folder to your Applications folder (not the Desktop)
- Double-click (or Right-click) the UN‑SCAN‑IT 6.2 Demo icon in the UN‑SCAN‑IT 6.2 Demo folder to open and run the program
Demo Version Info...
- The Free Demo is a fully functional version of the UN‑SCAN‑IT Graph Digitizing Software that includes several sample images, and also allows you to digitize your own sample image. The software should be intuitive, and there are context sensitive help buttons available.
- We recommend first digitizing one of the included sample graph images to familiarize yourself with the digitizing process.
- A Demo Video and Tutorial can be found below.
- An online User's Manual is available at www.silkscientific.com/manual/Manual62.pdf
- To purchase the full version, ordering information is available at www.silkscientific.com/order
- Customer Support: Email: info@silkscientific.com Tel: 1-801-377-6978 (USA)
Demo Video and Tutorial
Thank you for using the UN‑SCAN‑IT Demo software. Although the demo program should be intuitive, and does contain context sensitive help information, please let us know if you have any questions regarding the use of this demo program or any of the UN‑SCAN‑IT features. If you would like us to offer direct assistance for your particular sample image, you can email a copy of the image to info@silkscientific.com and we can offer assistance.
Demo Tutorial Video | Graph Digitizing
Click here for Graph Digitizing Demo Tutorial Video (YouTube)
Demo Tutorial Text | Graph Digitizing
The UN‑SCAN‑IT software easily converts pixel locations from graph images into useful (x,y) data. The data can be used to analyze the graph, integrate peak areas, re-scale graphs, remove grid lines, smooth data, prepare publication quality graphs, etc. The (x,y) data can also be exported into spreadsheet, graphics, or data analysis software.
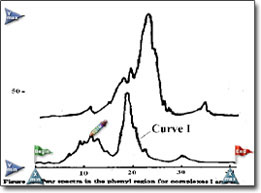
Digitizing the Sample Graph
After the introductory demo screen has displayed, select Digitize a Graph from the welcome screen (or select Digitize (x,y) Graph from the main menu). Select any of the displayed sample images. Once the sample scanned image has loaded, the Graph Digitizing Mode and Graph Digitizing Options settings will appear (descriptions of each of the options can be accessed by clicking the Help button). Although you can adjust these selections, the default settings are generally correct for the sample image. Click OK to accept these settings.
You will be prompted to define the scale and other setup parameters on the graph by dragging the setup icons to their corresponding graphical locations. You can drag the icons by clicking the left mouse button and dragging the icon to the desired location (hold mouse and arrow keys for fine movement). The crosshair magnification in the upper right corner of the digitizing screen is useful for obtaining precise alignments during the axis setup process (the crosshair magnification is for visual alignment purposes only, and all crosshair movements should be performed on the main image). After finishing the setup, click the Digitize button to automatically digitize the image. You can toggle between automatic and manual mode during the digitizing process by clicking the Pause and Continue buttons. When the digitizing process is paused (Manual Mode), you can access and change settings in the Options menu or add additional points manually. When the digitizing process is complete, you can accept the digitized data values and/or digitize additional points.
Graphing the Data
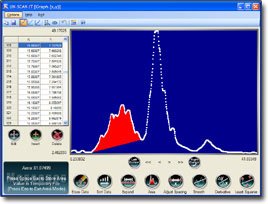
To graph, analyze, or edit the data points from within UN‑SCAN‑IT, select Graph /Modify (x,y) Data from the Graph menu contained on the main page. The buttons on the graphing screen allow you to integrate peak areas, adjust x data spacing, smooth data, edit data, take derivatives, etc. Additional graphing choices are also contained in the Options menu.
Integrating Peak Areas - To integrate a peak area, move both graphic cursors to their desired locations. The Left and Right Cursors can be selected by clicking on the appropriate buttons at the bottom of the graph. The cursors can be moved with the mouse or arrow keys. The (x,y) value of the data point at the active cursor appears in the corresponding spreadsheet. Click the Area button to calculate the peak area between the cursors. Press Esc to return to normal graphing mode.
Digitizing Your Own Image (Passcode)
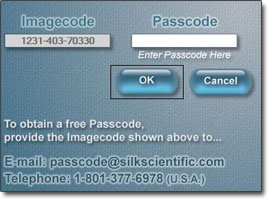
The demo program will also allow you to test digitize your own image. You should scan and save your image "right side up" in a standard image format (TIF, JPG, BMP, PNG, etc.). To digitize your own image, load the image into the Digitize (x,y) Graph Image portion of the demo software. The program will then display a unique Imagecode. Contact us by telephone or Email with that Imagecode, and we will provide the corresponding Passcode that allows that image to be digitized. The Imagecode and Passcode are unique to each image.
Automatic vs. Manual Modes
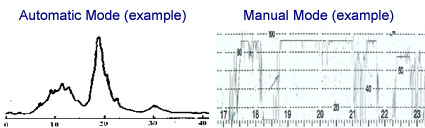
Use one of the UN-SCAN-IT Automatic Modes if your graph is relatively straightforward (continuous line without much overlap, interference, etc.).
Use the UN-SCAN-IT Manual Mode if your graph is more complex (faint/broken lines, symbols, scatter plot, etc.).
Although the steps involved in digitizing your own image are generally similar to those described for the sample graphs, each image can present its own unique issues. Please contact us and/or email us a copy of your sample image file if you would like additional assistance digitizing your own image.
Email: info@silkscientific.com Tel: 1-801-377-6978 (USA)
Saving the Data
To save the (x,y) data for further analysis or graphing using other software… select Save (x,y) Data from the drop-down File or Options menu. UN‑SCAN‑IT can save the data in ASCII text format (tab or comma delimited), which can be read by most spreadsheet, graphics, and data analysis programs. The data can also be copied to the clipboard , and pasted directly into other software.
Help
Although the demo program should be intuitive, these instructions only touch upon many of the features of the software. Context sensitive help is available throughout the software. If you have any questions regarding the use of this demo program or any of the UN‑SCAN‑IT features, please let us know.
Silk Scientific, Inc. 1060 Oakmont Lane Provo, UT 84604 USA
Tel: 1-801-377-6978 | Fax: 1-801-228-2448
Email: info@silkscientific.com
Copyright © 2026 Silk Scientific Inc. All rights reserved.