How to Analyze Electrophoresis Gels
The UN‑SCAN‑IT gel software allows you to use your scanner like a gel densitometer to analyze a variety of electrophoresis gels. UN‑SCAN‑IT gel can be used for protein analysis, PCR detection, DNA gel sequencing, thin layer chromatography (TLC) analysis and quantification, etc. Although there are many options and considerations associated with quantifying and analyzing electrophoresis gels, most of the basic steps remain the same. If you would like to try some of the gel analysis steps described on this page, you can download our free demo program at https://www.silkscientific.com/demo/demo-gel.htm.
Basic Setup | How to Analyze a Gel
The first step to analyze a gel is to obtain and load a standard image file (JPG, TIFF, GIF, BMP, PNG, etc.). The gel image file can come from a scanner, digital camera, converted PDF file, email, internet, etc. The UN‑SCAN‑IT gel software can accept a variety of image formats for gel quantification (see Figure 1).
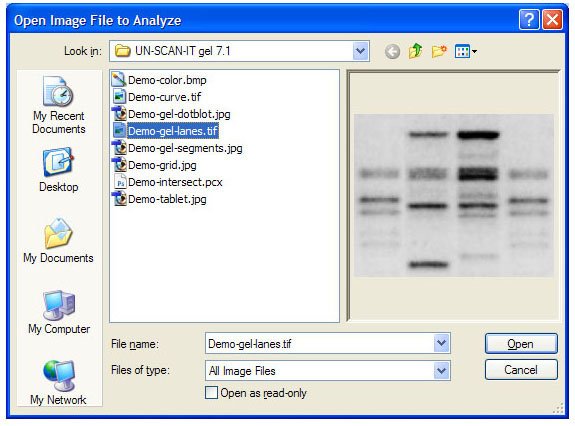
Figure 1. Load the gel image file.
The next step to is to select the Gel Analysis Mode. These options allow you to choose between a variety of gel analysis modes which include Lane Analysis, Segment Analysis, and Dot Blot Analysis (see Figure 2). A descriptions of these options can be displayed by selecting the Help button from the Gel Analysis Mode screen.
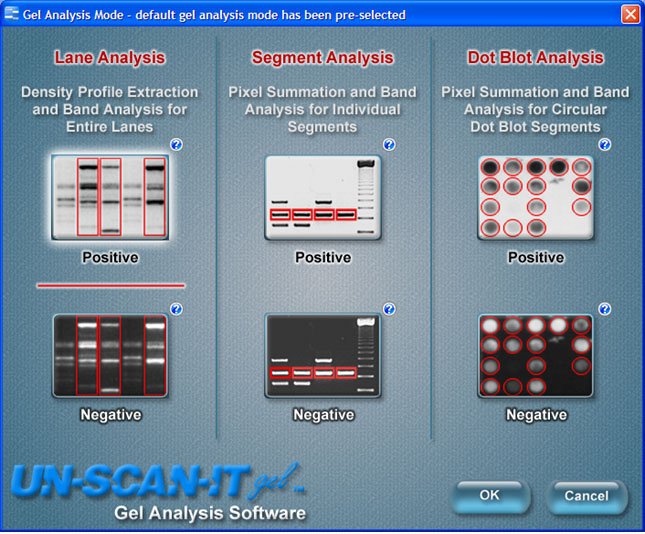
Figure 2. Select the Gel Analysis Mode.
The Gel Analysis Options screen will appear next. This screen allows you to choose the options that best fit your gel analysis needs. These options include Background Correction, Optical Density Calculation, and Lane/Segment Drawing Method (see Figure 3). Details regarding these options can be displayed by selecting the Help button from the Gel Analysis Options screen.
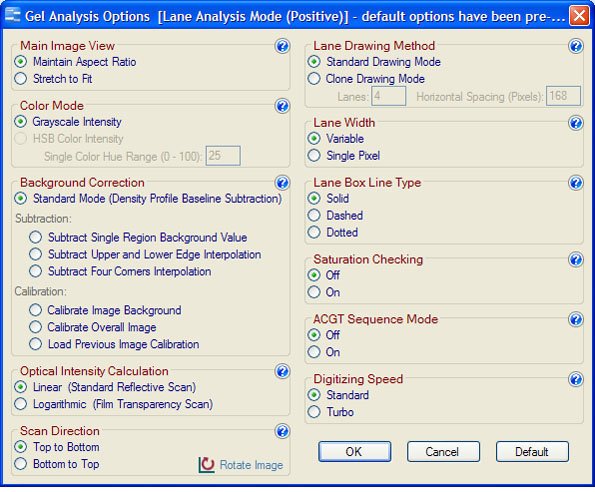
Figure 3. Select the Gel Analysis Options.
Defining Lanes and Segments | How to Analyze a Gel
After the Gel Analysis Options have been selected, your gel image will be displayed along with several buttons that can make drawing lanes/segments easier. Lane and segment boxes can be created by simply clicking and dragging the mouse within the main image to identify the region of interest (see Figure 4).
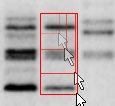
Figure 4. Define the Lanes/Segments of Interest.
In order to obtain optimal quantification, the boxes should generally be drawn large enough to include the entire region of interest for each band. Once all of the lanes/segments have been properly defined, select the Analyze button located in the lower right corner of the analysis screen (see Figure 5).
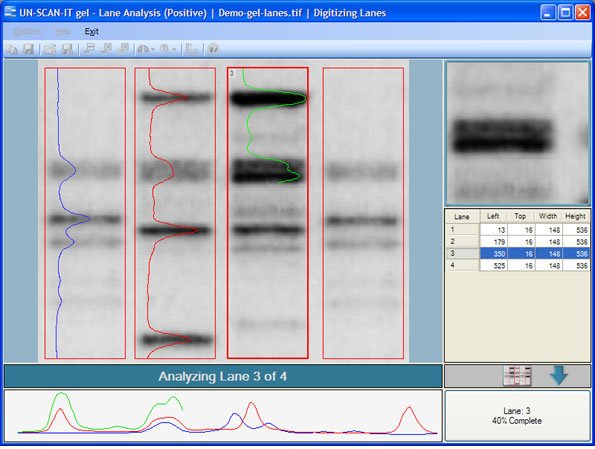
Figure 5. Gel Setup Screen after the Lanes/Segments have been defined.
Analyzing the Gel | How to Analyze a Gel
If the Gel Analysis Mode is Lane Analysis, then a density profile plot for each lane will appear on the screen (see Figure 6). Although many of the peaks in the profile are found automatically, you can add or delete peaks by clicking the appropriate button. The peak baseline locations can be adjusted by using the mouse to drag the endpoints of the peak baseline to the desired position. To integrate the pixel intensity area for each peak in the lane, click the Quantify Peaks button. Only the data above the baseline/background will be included in the area calculation. After Quantify Peaks and Continue are selected, the program will then repeat the density profile process for the remaining lanes.
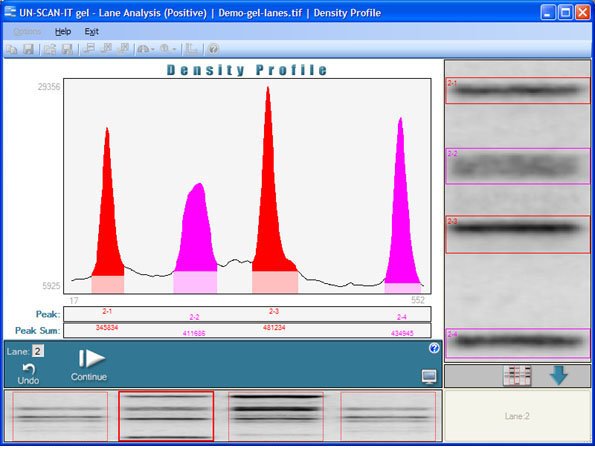
Figure 6. Density Profile screen in Lane Analysis Mode.
Analyzing & Exporting the Data | How to Analyze a Gel
When the analysis of all of the lanes/segments is complete, the band positions and locations will be shown on the gel image, with the band parameters displayed in the spreadsheet at the bottom of the screen (see Figure 7). Calibration curves for concentration and/or molecular weight can be calculated using the results spreadsheet. Simply double click the bottom spreadsheet Mol Weight or Concentration column for a segment of known value and enter the value. Entering the values for two or more segments will result in remaining values being calculated and displayed in the spreadsheet. A calibration curve for the Concentration and Molecular Weight values for each band can be displayed by clicking the Show Concentrations or Show Mol. Weights buttons on the toolbar of the results screen.
Figure 7. UN‑SCAN‑IT gel results screen.
The gel data can then be saved and exported from UN‑SCAN‑IT gel into other spreadsheet, data analysis, or presentation programs (see Figure 8).
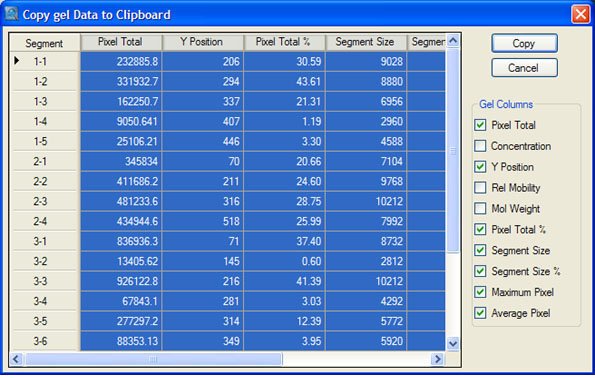
Figure 8. UN‑SCAN‑IT gel Copy to Clipboard screen.
Click Here for Gel Analyzer Tutorial...
Additional Information