Gel Analysis Software
Free Demo
37 Years Experience | Free Telephone & Email Support!
UN‑SCAN‑IT gel Free Demo | Windows
Click Here to Download the Free Demo Version of UN‑SCAN‑IT gel for Windows
- Click on the link above
- Download and run the installation file setup.exe
- Run the UN‑SCAN‑IT gel demo program (demo.exe) from the Desktop, Run Menu, or Programs Menu
Demo Version Info...
- The Free Demo is a fully functional version of the UN‑SCAN‑IT gel - Gel Analysis Software that includes several sample images, and also allows you to analyze your own sample image. The software should be intuitive, and there are context sensitive help buttons available.
- We recommend first analyzing one of the included sample gel images to familiarize yourself with the analysis process.
- A Demo Video and Tutorial can be found below.
- An online User's Manual at www.silkscientific.com/manual/Manual71.pdf
- To purchase the full version, ordering information is available at www.silkscientific.com/order
- Customer Support: Email: info@silkscientific.com Tel: 1-801-377-6978 (USA)
UN‑SCAN‑IT gel Free Demo | Macintosh
Click Here to Download the Free Demo Version of UN‑SCAN‑IT gel for Macintosh
- Click on the link above
- Save the download file UNSCANIT gel 6.3 Demo.dmg to your Macintosh
- Open the disk image and drag the UN‑SCAN‑IT gel 6.3 Demo folder to your Applications folder (not the Desktop)
- Double-click (or Right-click) the UN‑SCAN‑IT gel 6.3 Demo icon in the UN‑SCAN‑IT gel 6.3 Demo folder to open and run the program
Demo Version Info...
- The Free Demo is a fully functional version of the UN‑SCAN‑IT gel - Gel Analysis Software that includes several sample images, and also allows you to analyze your own sample image. The software should be intuitive, and there are context sensitive help buttons available.
- We recommend first analyzing one of the included sample gel images to familiarize yourself with the analysis process.
- A Demo Video and Tutorial can be found below.
- An online User's Manual at www.silkscientific.com/manual/Manual63.pdf
- To purchase the full version, ordering information is available at www.silkscientific.com/order
- Customer Support: Email: info@silkscientific.com Tel: 1-801-377-6978 (USA)
Demo Video and Tutorial
Thank you for using the UN‑SCAN‑IT gel Demo software. Although the demo program should be intuitive, and does contain context sensitive help information, please let us know if you have any questions regarding the use of this demo program or any of the UN‑SCAN‑IT gel features. If you would like us to offer direct assistance for your particular sample image, you can email a copy of the image to info@silkscientific.com and we can offer assistance.
Demo Video | Gel Analysis
Click here for Gel Analysis Demo Tutorial Video (YouTube)
Demo Tutorial | Gel Analysis
The UN‑SCAN‑IT gel software contains features for analyzing electrophoresis gels, TLC plates, and other gel images. The data can be used to determine optical densities, relative concentrations, band locations, and molecular weights.
Analyzing the Sample Gel
After the introductory demo screen has displayed, select select Analyze a Gel from the welcome screen (or select Analyze Gel from the main menu). Select any of the displayed sample images. Once the image has loaded, the Gel Analysis Mode and Gel Analysis Options will appear (descriptions of each of the options can be accessed by clicking the Help button). Although you can adjust the Gel Analysis Mode and Gel Analysis Options selections, the default settings are generally correct for the sample image. Click OK to accept these settings.
Lane Analysis
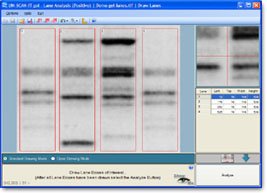
You will be prompted to define the lanes of interest; to do so, click on the upper left-hand and corner of the desired lane and drag the mouse cursor to the lane's lower right-hand corner. Additional lanes can be drawn using the steps above, or the lane(s) can be copied (see Options menu) to ensure equally sized lanes. To relocate any lane, move the crosshair until the desired lane is highlighted, then click and drag the lane to its proper location. Additionally, the lane positions and sizes can all be adjusted by selecting Align Regions of Interest from the Options menu or by editing the values in the grid on the right side of the screen. When all of the lanes have been defined, click the Analyze button.
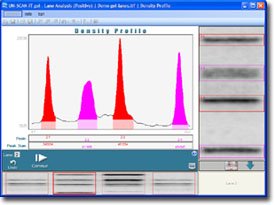
A density profile plot for each lane will appear on the screen. Although many of the peaks in the profile are found automatically, you can add or delete peaks by clicking the appropriate button. The peak baseline locations can be adjusted by using the mouse to drag the endpoints of the peak baseline to the desired position (the adjustments can be seen on the image at the right of the screen). To integrate the optical intensity area for each peak in the lane, click the Quantify Peaks button. Only the data above the baseline/background will be included in the area calculation, and this value will later be displayed as Pixel Total. After Quantify Peaks and Continue are selected, the program will then repeat the density profile process for the next lane.
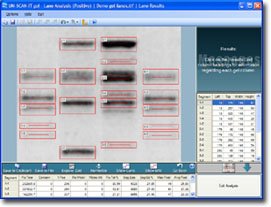
When the analysis of all of the lanes is complete, the band positions and locations will be shown on the gel image and the band parameters displayed in the grid at the bottom of the screen. To calculate the molecular weight, double click the bottom grid Mol Weight column for the desired segment of known value and enter the value. Entering the value for two or more segments will result in molecular weight being calculated for the remaining segments (based on a standard least squares fit of Position vs. Log MW).
Segment and Dot Blot Analysis
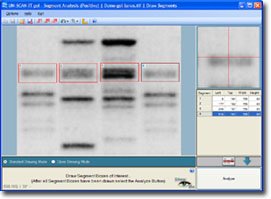
You will be prompted to define the segments of interest; to do so, click on the upper left-hand corner of the desired segment and drag the mouse cursor to the segment's lower right-hand corner. Additional segments can be drawn using the steps above, or the segment can be copied (see Options menu) to ensure equally sized boxes. To relocate any segment box, move the crosshair until the desired segment is highlighted, then click and drag the box to its proper location. Additionally, the segment positions and sizes can all be adjusted by selecting Align Regions of Interest from the Options menu or by editing the values in the grid on the right side of the screen. When all of the segments have been defined, click Analyze in the lower right corner of the screen.
Background Corrections
Although the background is automatically subtracted when analyzing lanes (using the density profile), the segment analysis mode simply sums the pixel values for all pixels contained in the segment box. Therefore, a non-zero background will result in higher pixel totals due to additional background values being included in the sum. Background interference can be reduced or eliminated by selecting the Background Correction feature during the Setup process.
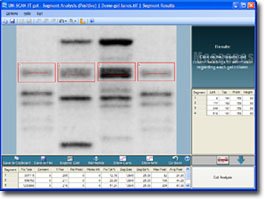
When the analysis of all of the segments is complete, the band positions and locations will be shown on the gel image and the band parameters displayed in the grid at the bottom of the screen. To calculate the molecular weight, double click the bottom grid Mol Weight column for the desired segment of known value and enter the value. Entering the value for two or more segments will result in molecular weight being calculated for the remaining segments (based on a standard least squares fit of Position vs. Log MW).
Concentration and MW Calibration Curves
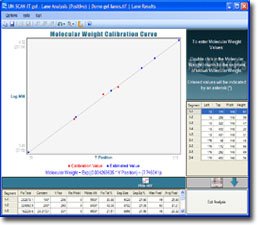
A calibration curve for both the Concentration and Molecular Weight values for each band can be displayed by clicking the Show Concentrations or Show Mol. Weights buttons on the toolbar of the results screen. In order to properly display the calibration curve, at least two concentration or molecular weight values must be entered in the lower spreadsheet for the standard or marker bands. The software will then use a standard least squares fit to estimate the values for the remaining bands.
Analyzing Your Own Image (Passcode)
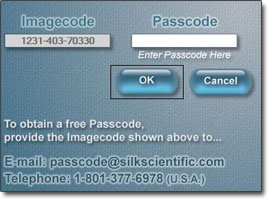
The demo program will also allow you to analyze your own image. You should scan and save your image "right side up" in a standard grayscale image format (TIF, JPG, BMP, PNG, etc.). To analyze your own image, load the image into the Analyze Gel Image portion of the demo software. The program will then display a unique Imagecode. Contact us by telephone or Email with that Imagecode, and we will provide the corresponding Passcode that allows that image to be analyzed. The Imagecode and Passcode are unique to each image.
Although the steps involved in analyzing your own image are generally similar to those described for the sample gels, each image can present its own unique issues. Please contact us and/or email us a copy of your sample image file if you would like additional assistance analyzing your own image.
Email: info@silkscientific.com Tel: 1-801-377-6978 (USA)
Saving the Data
To save the gel data for further analysis, calibration, or graphing using other software… Select Save gel Data from the File or Options menu. UN‑SCAN‑IT gel can save the data in ASCII text format (tab or comma delimited), which can be read by most spreadsheet, data analysis, and graphics programs. The data can also be copied to the clipboard, and pasted directly into other programs.
Help
Although the demo program should be intuitive, these instructions only touch upon many of the features of the software. Context sensitive help is available throughout the software. If you have any questions regarding the use of this demo program or any of the UN‑SCAN‑IT gel features, please let us know.
Silk Scientific, Inc. 1060 Oakmont Lane Provo, UT 84604 USA
Tel: 1-801-377-6978 | Fax: 1-801-228-2448
Email: info@silkscientific.com
Copyright © 2026 Silk Scientific Inc. All rights reserved.