Converting Scanned Graphs to (x,y) Data
The development of the 20th century computer was fueled largely by the needs of the scientific community to store and analyze large amounts of scientific data. With the later development of the personal computer and graphics printer, scientists were able to easily display and print graphical representations of their data sets. In recent years, hardware and software (image scanners and digitizing software) have been developed that allow scientists to easily extract (and therefore analyze) data from printed materials such as strip chart recordings, old graphs, and graphs published in journals.
Although scanners and digital video systems were developed primarily to input and manipulate pixel images such as pictures, drawings and photographs (1), it soon became clear that information could be extracted from other types of scanned images. Optical Character Recognition (OCR) software was developed to extract alphanumeric characters automatically from the scanned pixel image. If the alphanumeric characters could be extracted from textual images, then (x,y) coordinates of data points could be extracted automatically from graphical images to convert graphs to data. This opportunity sparked the development of the UN‑SCAN‑IT graph digitizing software.
How it Works | Converting Scanned Graphs to (x,y) Data
For decades, extracting underlying (x,y) data values from printed graphs has been accomplished using digitizing tablets (2). Digitizing tablets use the position of the puck (mouse-like device) on the digitizing board to correspond to a calibrated coordinate system associated with the underlying graph. In addition, digital plotters have been used in a manner similar to digitizing tablets, by manually moving the plotter pen to various positions over the hard copy graph (3). This basic concept can also be used to convert the pixels in scanned images to (x,y) data values. How it works is the software simply assigns a coordinate system to the pixels in the image based upon the scaling values entered from the original graph (see Figure 1).
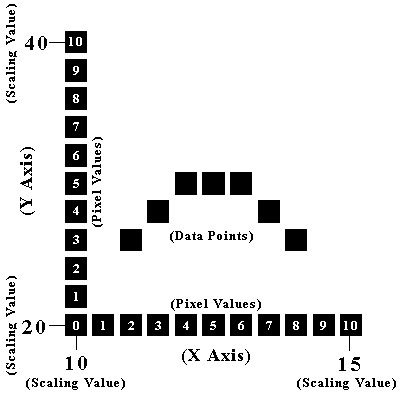
Figure 1. Correspondence between the pixel values of the scanned image and the scaled values of the graph. For example, each pixel in the x direction corresponds to 0.5 scaled x units [(15-10)/(10-0)], while each pixel in the y direction corresponds to 2.0 scaled y units [(40-20)/(10-0)].
To use a scanner as a digitizer and accurately convert a scanned graph to (x,y) data, the scanned image must be properly scaled, which requires 4 points to be defined (the lowest x, highest x, lowest y, and highest y locations and corresponding values must be entered). Although the basic concept of converting the image pixel values to scaled values is straightforward, practical consideration such as correcting for tilted graphs, overcoming the limits of screen resolution, and developing line following routines to automate the digitizing process must be addressed.
Practical Considerations | Converting Scanned Graphs to (x,y) Data
Tilted Graphs
Although desktop scanners can provide very high-resolution and accuracy in the scanning of paper images, it is generally difficult to load the paper into the scanner perfectly orthogonal. Therefore, the scanned images are often slightly tilted, and the perfectly orthogonal situation shown in Figure 1 is rarely achieved. This small tilt in the image, even less than one degree, can result in unacceptable levels of error in the digitized xy values if there is not a correction made. The tilt of the graph can be determined by measuring the delta y pixel and delta x pixel locations when defining the axis lines, and the corresponding correction made.
Overcoming the limits of screen resolution
The early versions of digitizing software simply digitized the screen image, rather than the full scanner image. With today’s high-resolution scanners and high end computers, typical scanned image dimensions can be several thousand pixels by several thousand pixels. These large images cannot be completely and accurately represented on a 640x480 or 1024x768 computer monitor. Therefore, in order to digitize the image at full scanner resolution, the entire image must be read into memory and only portions of the image displayed and digitized as the digitizing process occurs. This full scanner resolution digitizing yields much more accurate results than screen digitizing, and virtually no data are lost from the original scanned image.
Developing Line Following Routines
Although using a scanner to digitize hard copy graphs works much like a digitizing tablet, the scanner and digitizing software have the potential advantage of being fully automatic. Rather than sitting in front a digitizing tablet for hours to digitize manually, graphs can be digitized automatically in seconds.
Raster scanning data is a very simple way to convert the scanned image to (x,y) data values, however, scientists generally need single-valued vectorized data (one y for each x in sequential order). This requirement means that there must be a function in the digitizing software that automatically follows the data line, and assigns one (and only one) y value for each x value along a given curve.
If only one y value is to be assigned for each x value along the curve, then the middle of the data line is generally assumed to represent the actual (x,y) value. The middle of the data line is the point halfway between the top and bottom interface of the line (see Figure 2a). Although the mid-line assignment method works for many types of curves, it is generally not accurate for curves with sharp peaks. This error occurs due to the finite width of the data line on the up side of the peak overlapping the data line on the down side of the peak, thus creating an artificially low bottom surface of the peak (see Figure 2b). Due to the potential problem in assigning the (x,y) values for sharp peaks, the more generally applicable standard point assignment method is simply to measure the line thickness once in a flat area, then subtract off half of that line thickness from the top interface of the line (see Figure 2c).
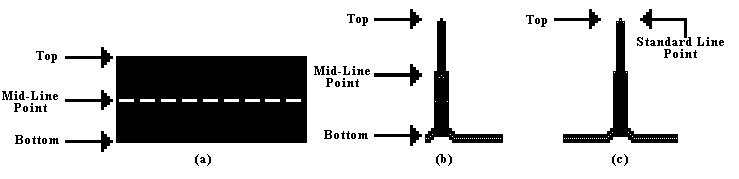
Figure 2. Point assignment methods. Mid-line method greatly reduces heights of sharp peaks, while the Standard line method retains sharp peak heights.
Once values of x and y values have been assigned to a point on the line, the line following routine moves one pixel unit in the x direction, begins an up and down search, and repeats the point assignment process. Although the line following process is straightforward for a simple curve, more complex graphs can be digitized easily with the UN‑SCAN‑IT software. Some additional features include the ability to select line follow direction, line follow side (top or bottom), scale (linear or logarithmic), resolution (distance between x values), as well as to pause the digitizing process for manual interaction and/or adjustment.
Results | Converting Scanned Graphs to (x,y) Data
In order to estimate the accuracy of the UN‑SCAN‑IT software, the standard geometric function y = sin(x) was generated and printed using a spreadsheet program and laser printer. The hard copy graph was then scanned at 300 dpi using a full page scanner. The UN‑SCAN‑IT software was then used to automatically follow the data line on the scanned image to extract the digitized (x,y) data values from the image (see Figure 3 and Table 1).
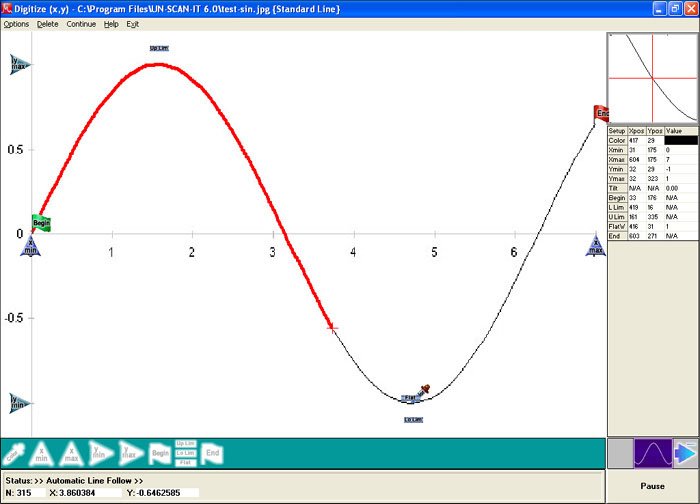
Figure 3. Screen image showing the UN‑SCAN‑IT graph digitizing screen.
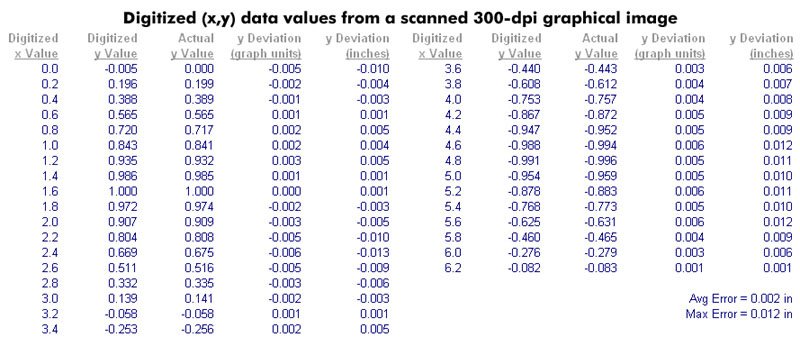
Table 1. Digitized (x,y) data values from a scanned 300 dpi graphical image. The average y deviation of the digitized values from the actual values was 0.002 inches, with a maximum deviation of 0.012 inches.
The UN‑SCAN‑IT automated digitizing software extracted 2,000 (x,y) data points in less than 10 seconds, once the axis limits were set. It can be seen from the results in Table 1 that the values obtained from the scanned image are precise and accurate, with typical deviations of approximately one scanner unit (the deviations that due occur result largely from imperfections in the printing and scanning processes). Using a scanner as a digitizer to convert graphs to (x,y) data can save countless hours and improve scientific results over manual digitizing methods.
References
(1) Marshall, G.R., Computer Graphics in Application (Prentice-Hall, Englewood Cliffs, NJ, 1987)
(2) Ryan, D.L., Modern Graphic Communications (Prentice-Hall, Englewood Cliffs, NJ, 1986)
(3) Silk, J.E. and Woolley, E.M., American Laboratory September (1990) 41.
Additional Information