Converting a Scanner into a Gel Densitometer
Can a standard scanner be used as a gel densitometer to quantify electrophoresis gels? The answer is Yes! With an increasing number of image scanners available in research laboratories, it would be of great value if these scanners could be used as analytical instruments, rather than just desktop publishing tools. With such an instrument the researcher could quickly and accurately quantify bands and perform gel analysis for a large variety of gel techniques... so we developed the UN‑SCAN‑IT gel analysis software.
How it Works | Converting a Scanner into a Gel Densitometer
In order for a scanner to be useful in extracting gel densitometry data from electrophoresis gel images, the image produced by the scanner must be an accurate representation of both the band positions and band intensities contained on the original gel. The spatial accuracy of a scanner can be tested by scanning a piece of paper containing grid lines, and measuring the distance in scanner units between the gradations in the scanned image file. The typical scanners tested were accurate to within one scanner unit (i.e. 1/300th inch for images scanned at 300 dpi). To accurately convert gel images to data, the scanner must also extract accurate image intensity information. In order to test how well scanners work for determining the gray scale intensity of images, a photographic gray scale image of known optical intensity (or optical density) was scanned in gray scale mode using a standard scanner, and the pixel values of each region were extracted. The results showed that the scanner does have a generally linear intensity response to the image being scanned, and the scanner can be effectively used as a densitometer within typical experimental parameters (see Figure 1).
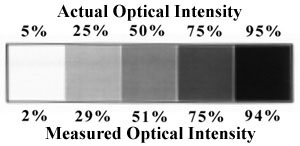
Figure1. Actual and measured optical intensity values obtained from a photographic image of known optical intensity.
To normalize image intensity values due to varying scanner settings and experimental gel conditions, the UN‑SCAN‑IT gel software allows the user to calibrate the image intensity (as well as correct for background). By highlighting an area of known intensity and inputting the desired intensity value, the software shifts the intensity values in the image to fit the calibrated regions.
Density Profile | Converting a Scanner into a Gel Densitometer
In order to analyze electrophoresis gel lanes and obtain a density profile for each lane, the software simply sums the intensity values for each pixel in each row of the lane. These pixel sums yield a density profile that can be used in the same manner as the density profile from a densitometer (see Figure 2).
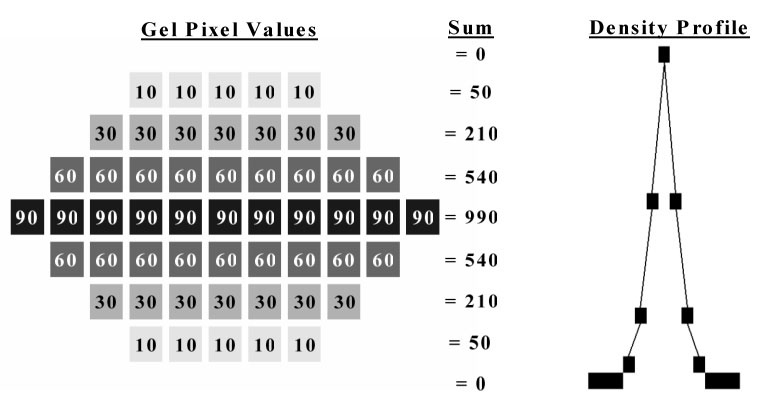
Figure2. Pixel values, pixel sums, and density profile for a theoretical gel band.
Once the density profile for each lane is obtained, the software finds the peak locations, peak areas, and associated background values that correspond to each band in the lane (see Figure 3). Additional peaks and backgrounds can be added or deleted if the software has incorrectly identified any of the peaks. After the density profiles for each lane are obtained, the location and intensity of each band is quantified, and the results are displayed in a spreadsheet format (see Figure 4).
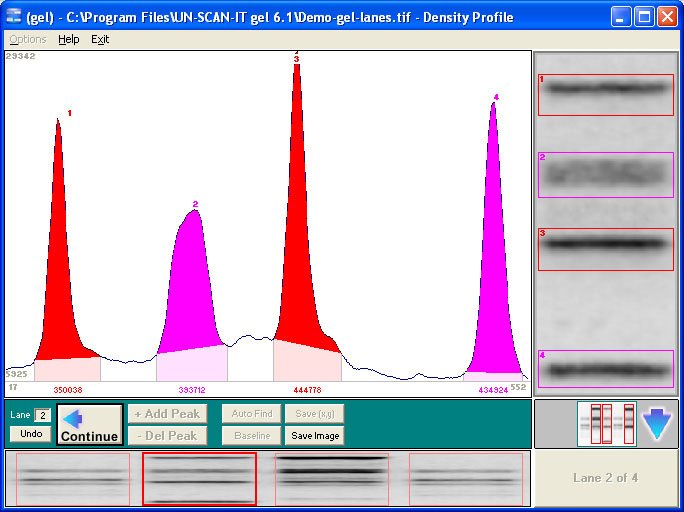
Figure 3. Screen image showing the density profile for a scanned gel image.
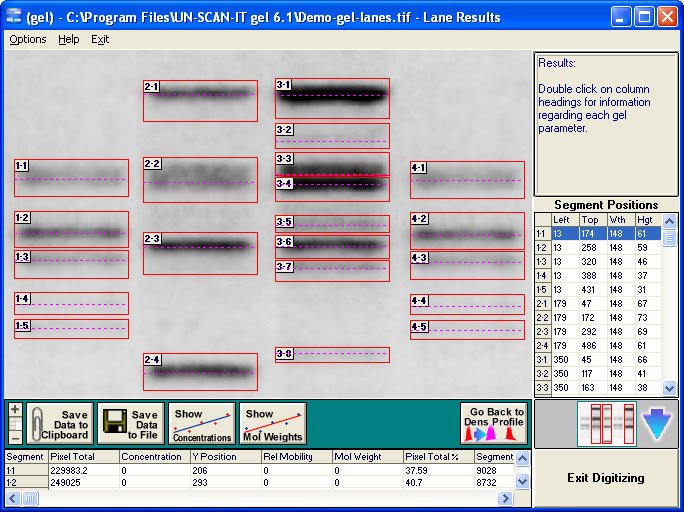
Figure 4. Screen image showing quantified gel band values.
If one of the analyzed gel lanes is a standard lane with molecular weight markers, the molecular weight values for two or more of the standard bands can be entered into the UN‑SCAN‑IT gel spreadsheet, and the molecular weight values for the remaining bands will be automatically calculated and displayed.
Conclusions | Converting a Scanner into a Gel Densitometer
Converting a standard image scanner into a gel densitometer is a relatively simple idea that has produced very useful results on both Windows and Macintosh systems. The UN‑SCAN‑IT gel software allows virtually any scanner, digital camera, or other image input device to be used for gel densitometry... and allows scientists to quantify their gel results without requiring access to an expensive and complex dedicated gel densitometry system.
Additional Information